Reusable chart component for internal dashboards
Instead of building charts separately for each screen of an oil refiner's internal dashboard system, we designed and built one chart component that many screens share. Every dashboard screen carries different data, and building charts per screen leaves as many copies of the same chart as there are screens. By separating the data from how it is displayed, the component draws the same way on any screen it is placed on. Inside the larger system build, we proposed the work ourselves and documented the component's structure and how to use it.
One shared component in place of charts rebuilt for every screen
Each screen of the internal dashboard system shows different data, and building a new chart every time leaves as many copies of the same kind of chart as there are screens. Rather than building for one screen, we aimed for a chart component that any dashboard screen could take and use. With one component there is one place to fix, and the fix reaches every screen that uses the chart.

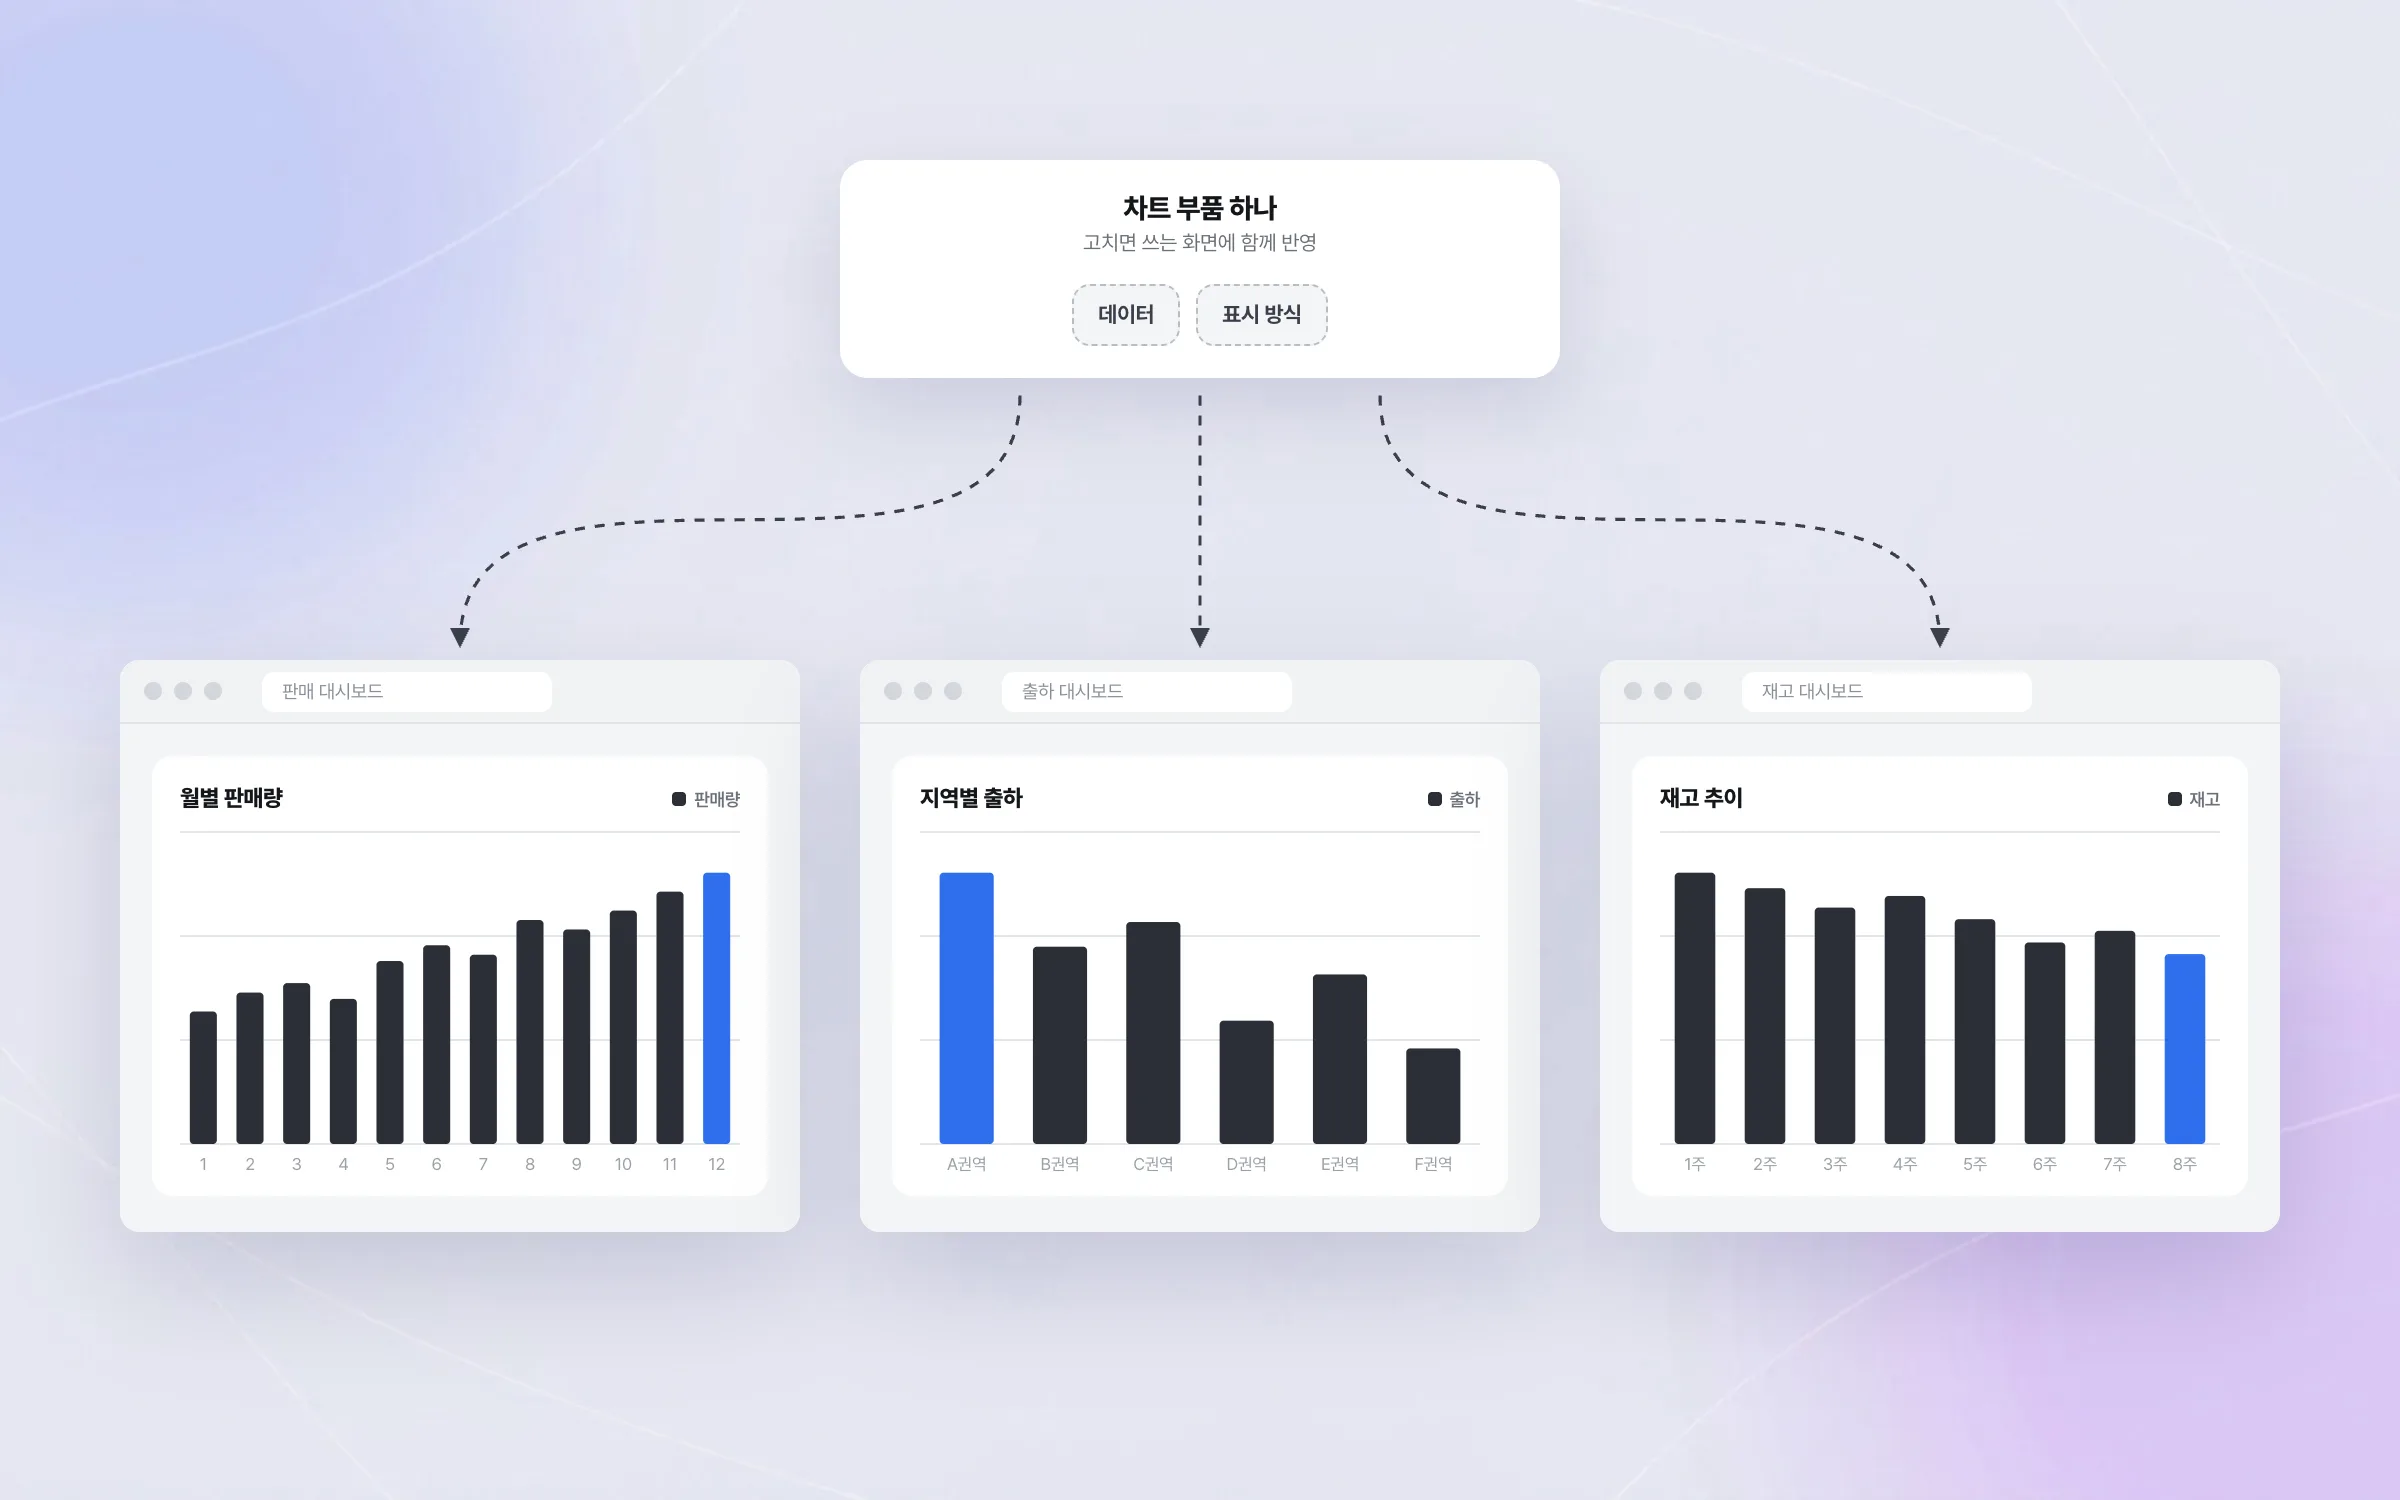
A design that takes data and display separately
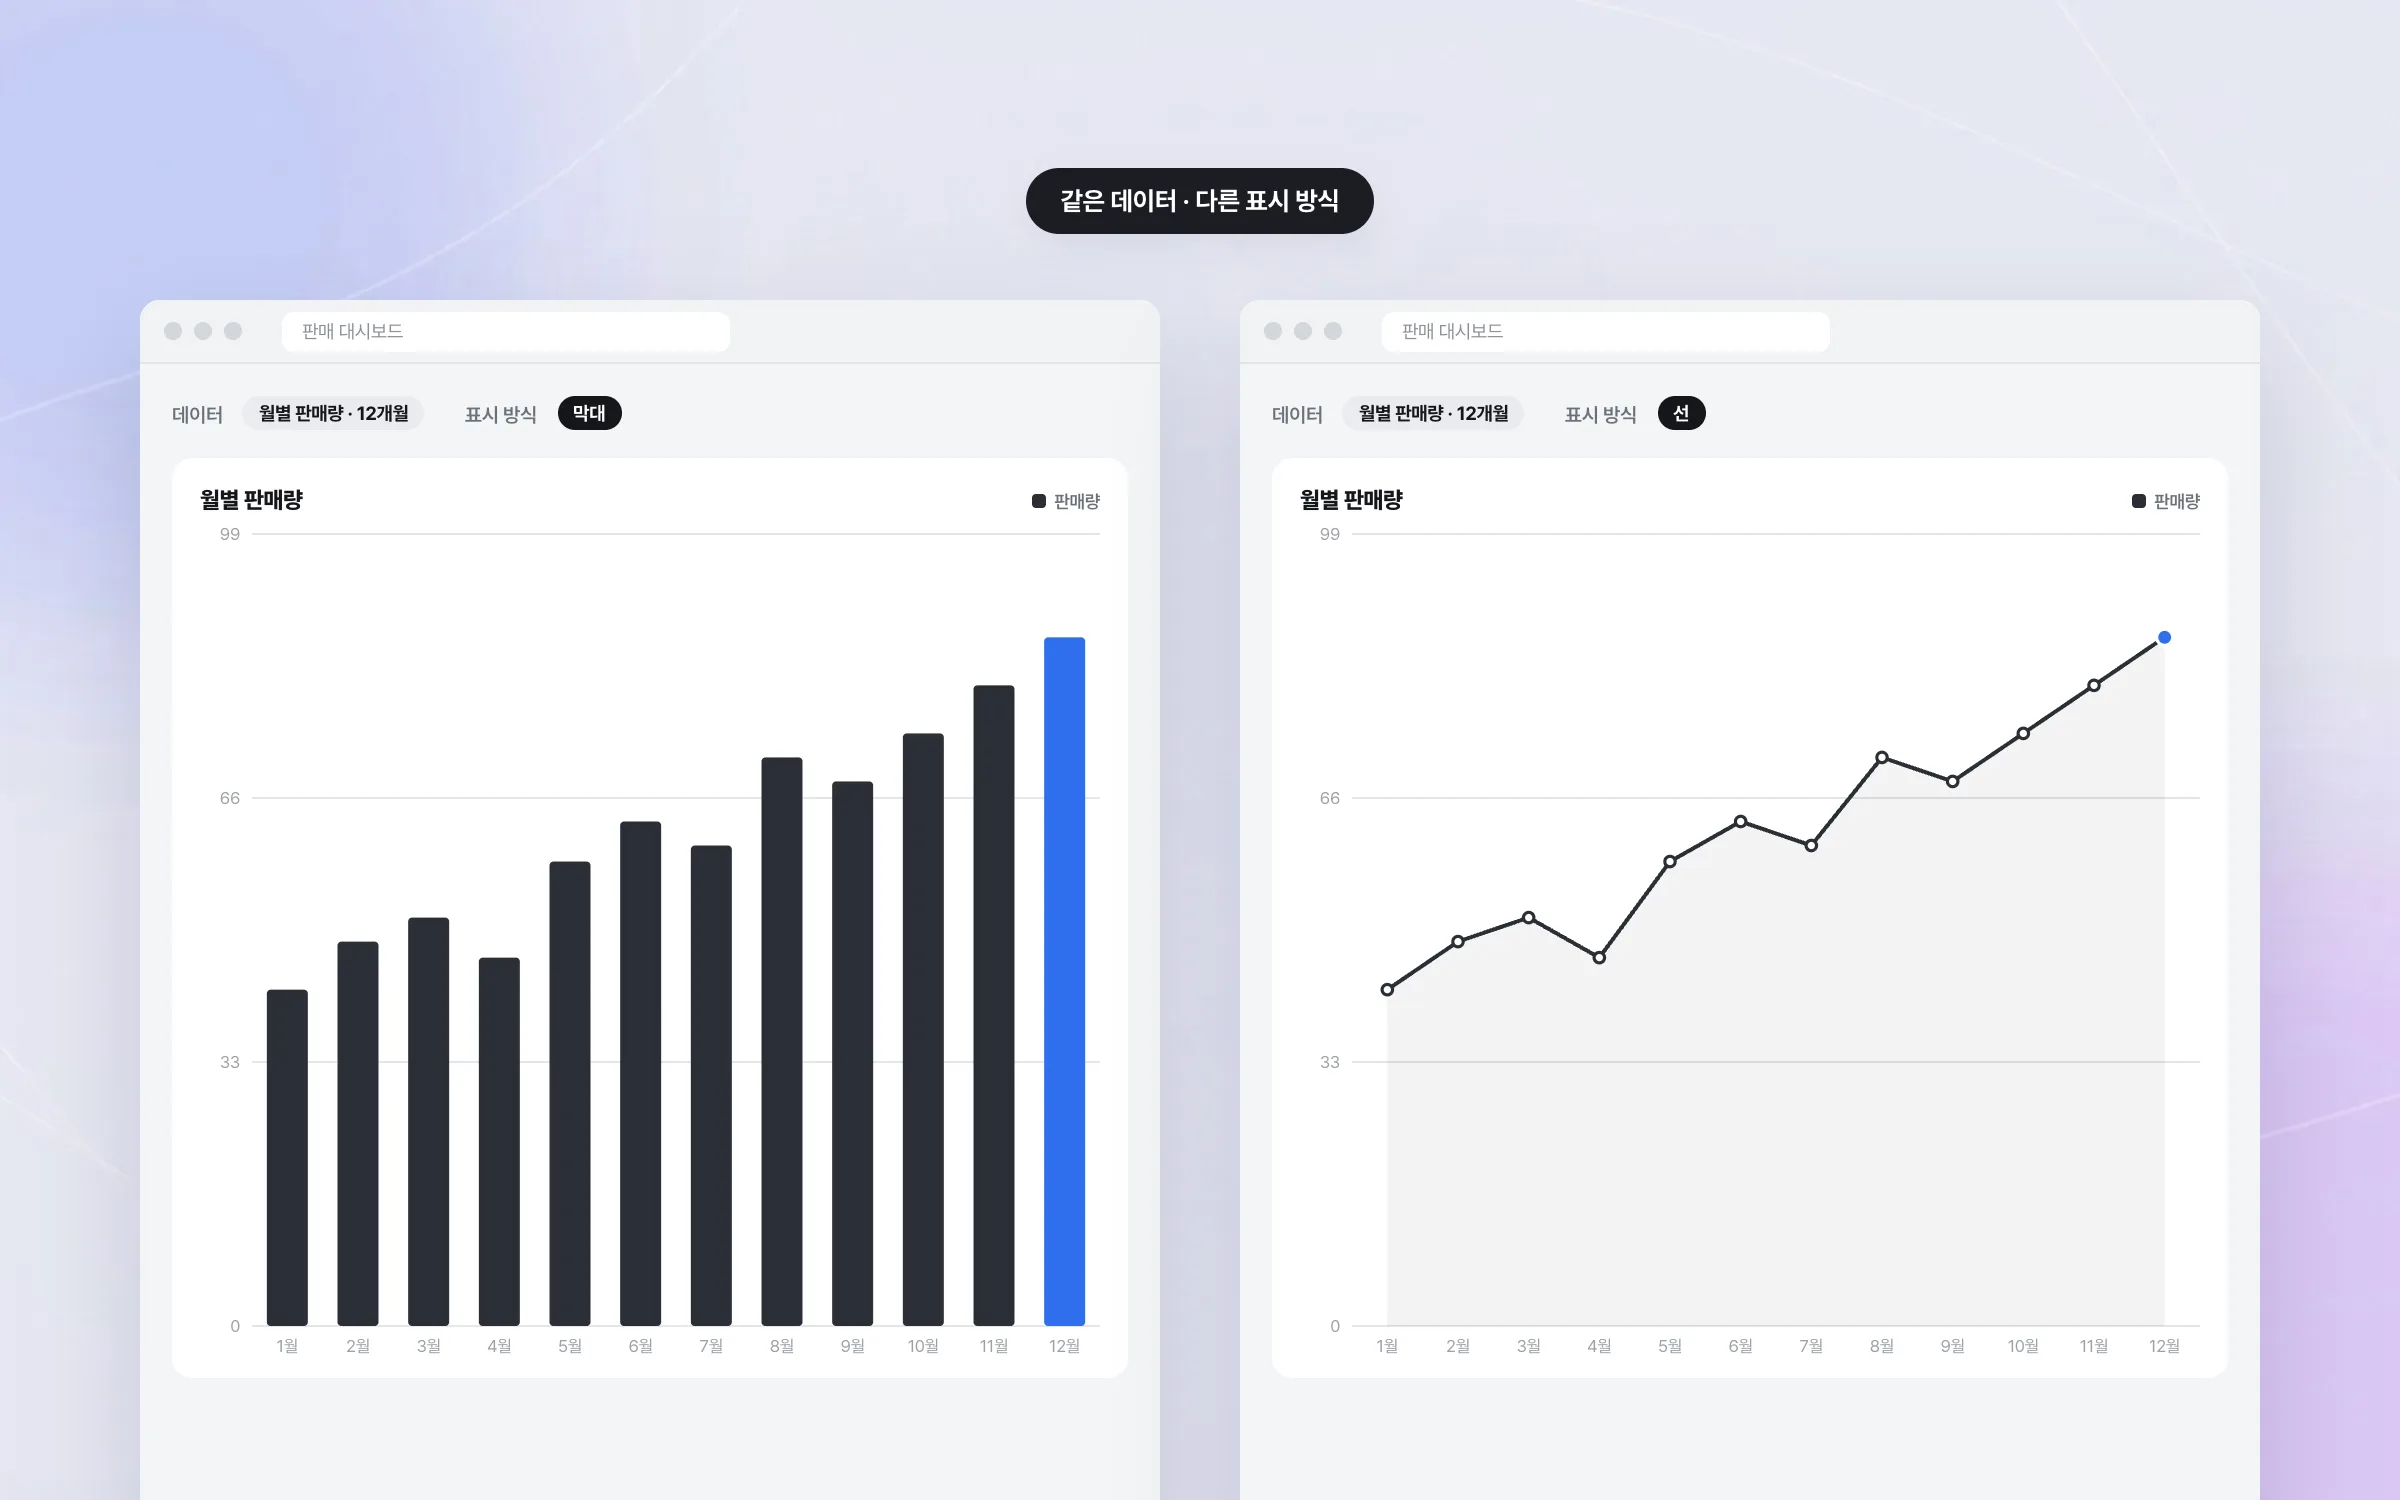
The reusable chart component takes the data to draw and the way to draw it as separate inputs. Swap only the data and the same component draws another screen's numbers; swap only the display and the same data appears as a different kind of chart. Built for a single screen, the two are bound together and hard to carry to another screen.

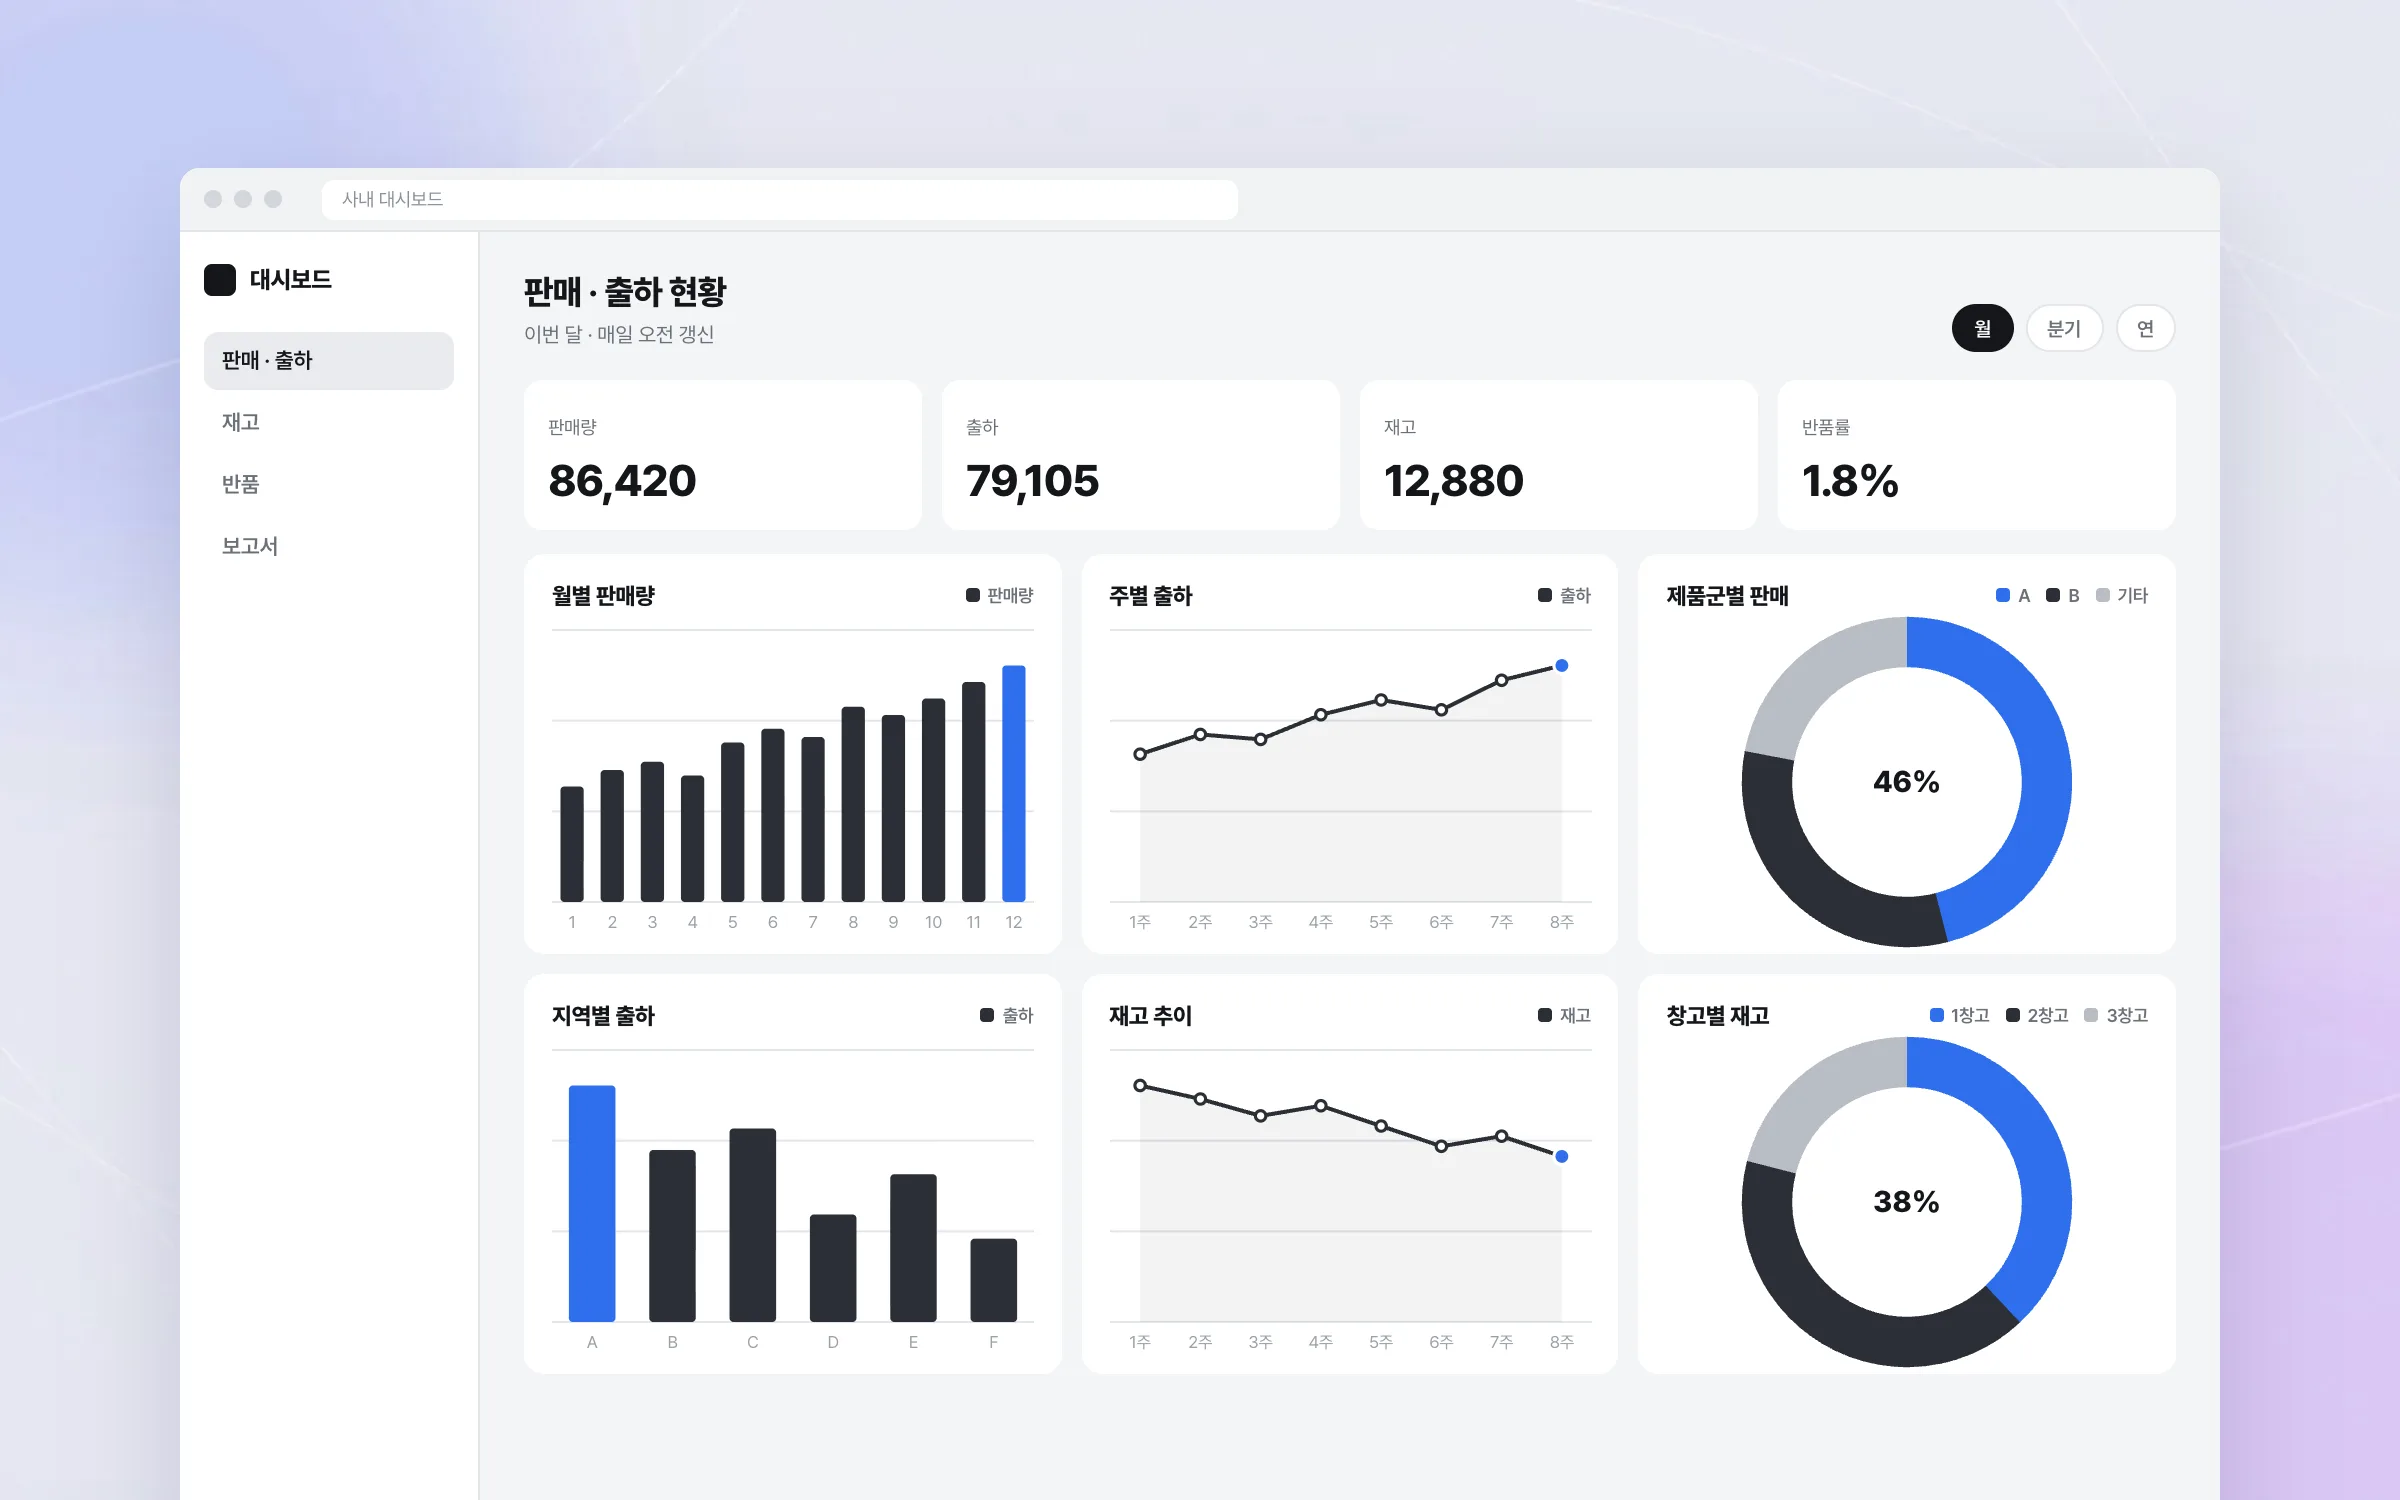
Charts that stay readable on dense business screens
A business dashboard packs numbers and charts tightly onto one screen. We aligned the component's interface so that dashboard data is presented the same way whatever the chart type. We refined how the charts look by weighing how much information fits on a screen, how easy it is to read, and how quickly the screen responds.

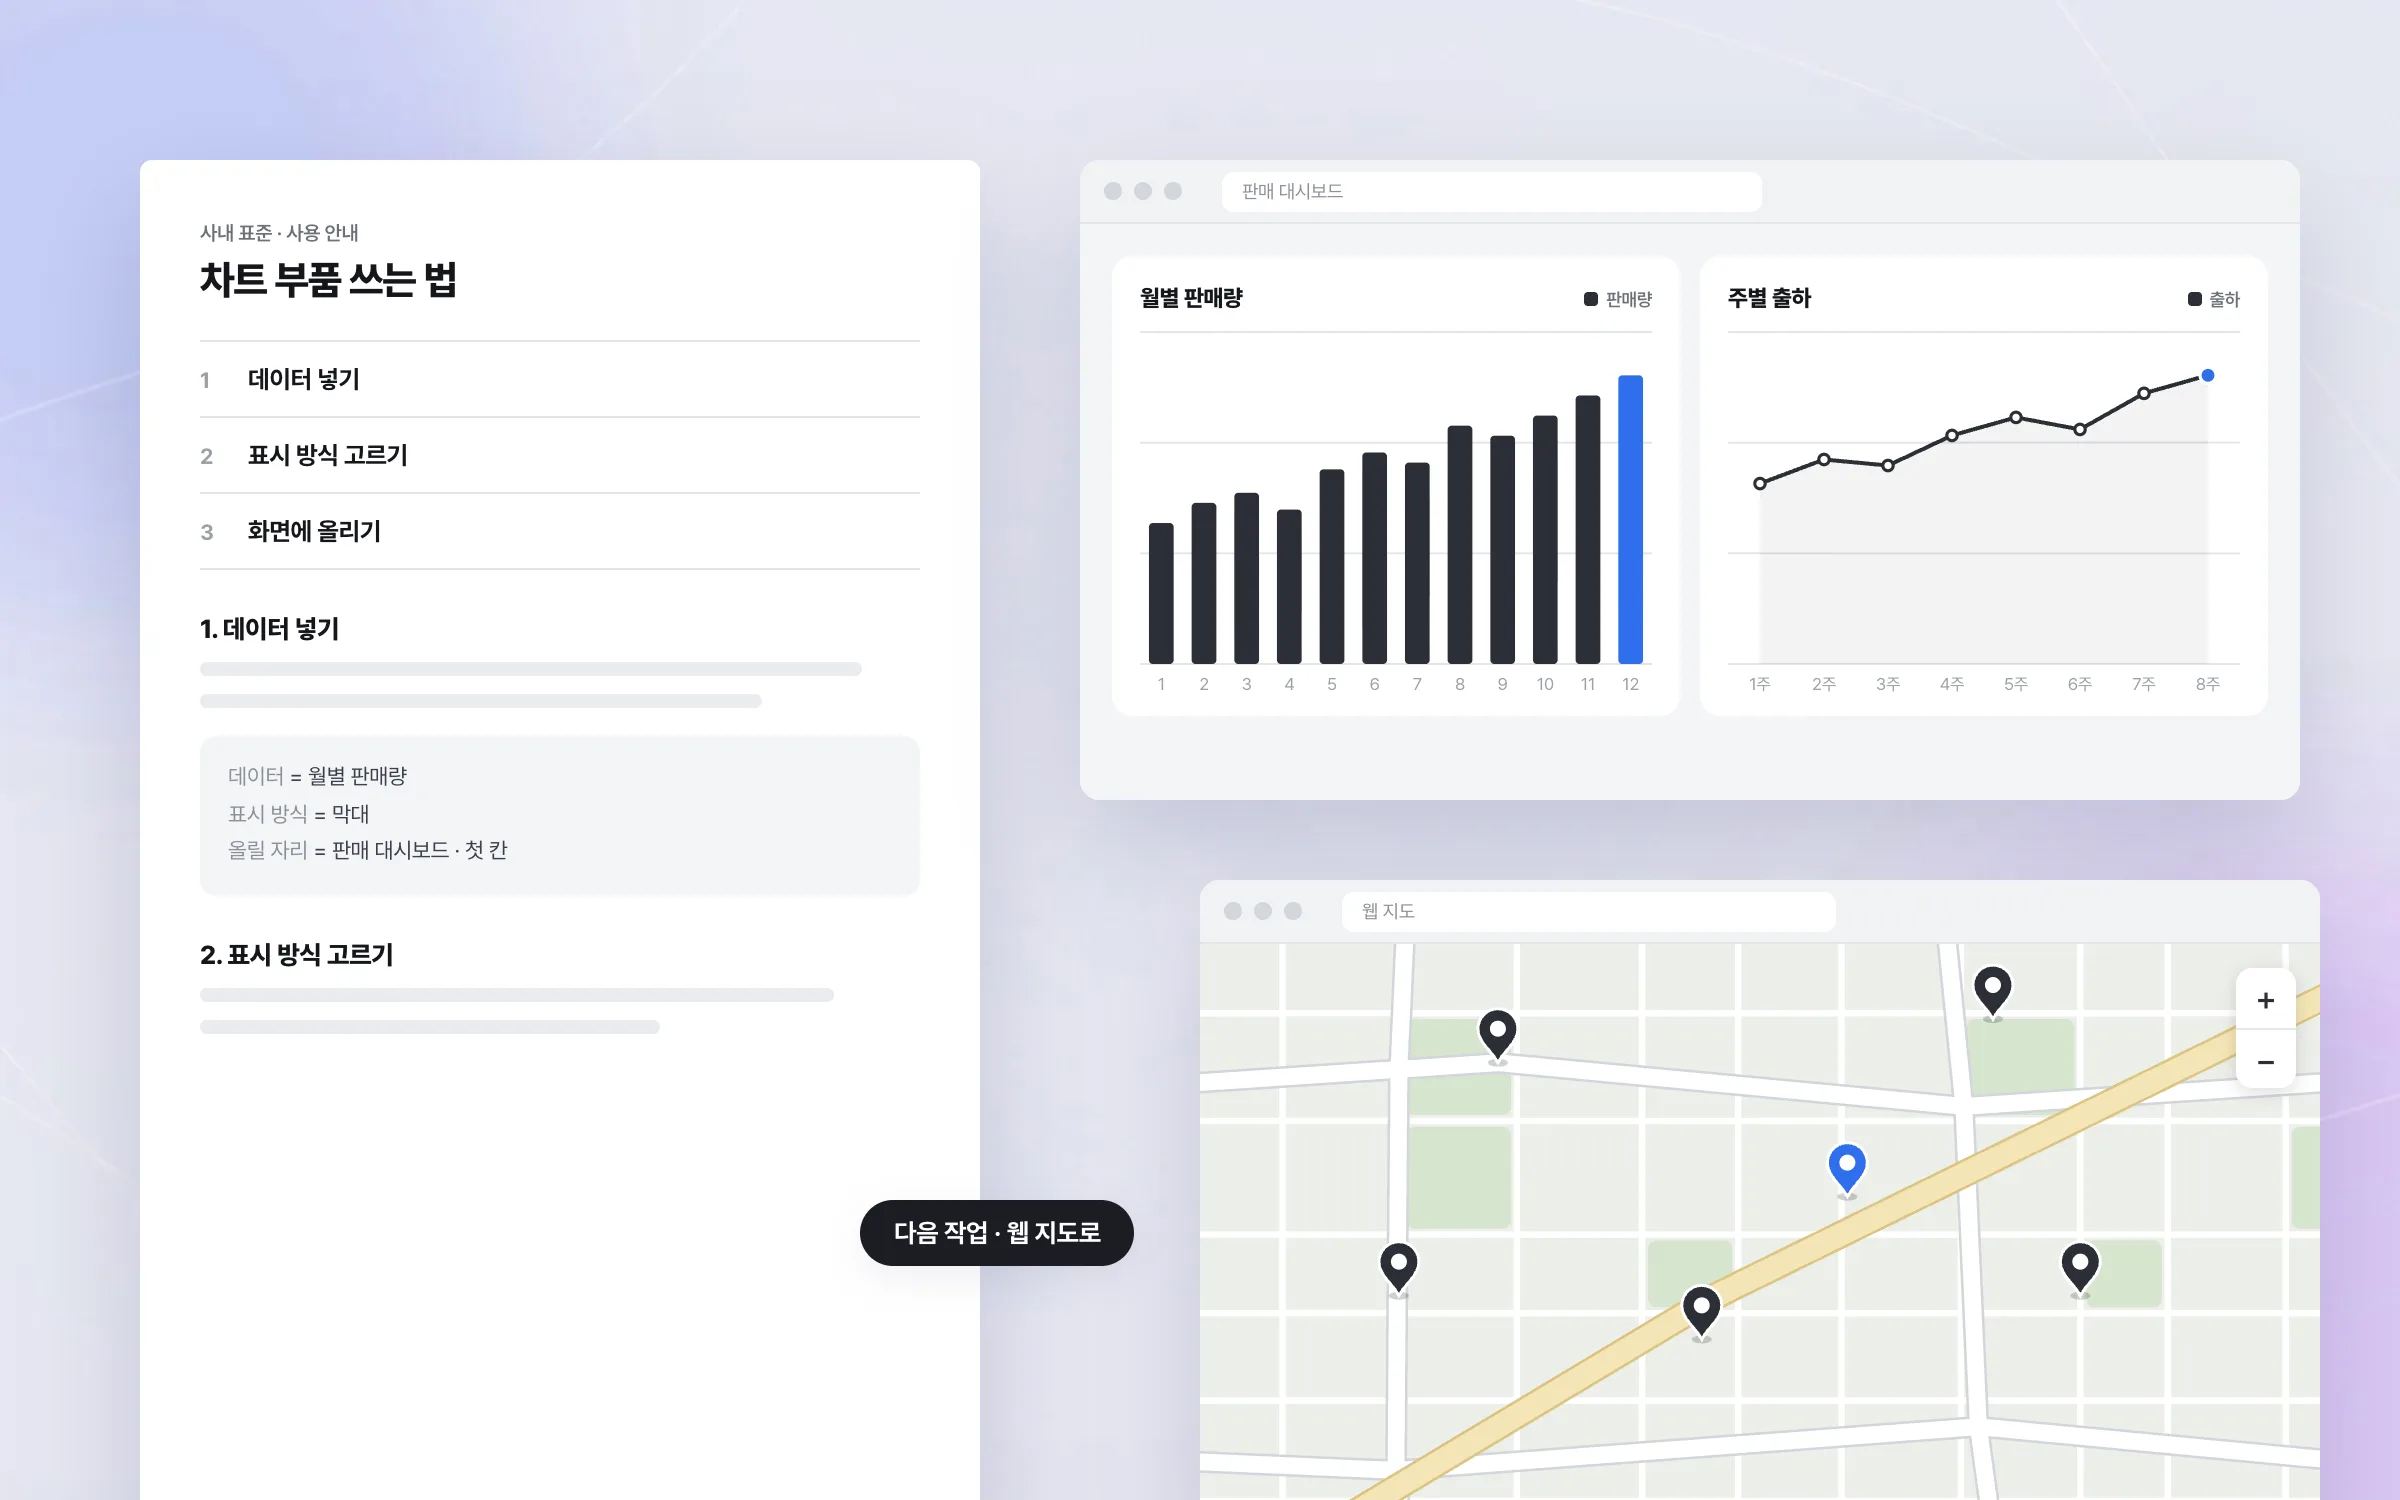
Component standardization started on our own inside a larger build
The chart component was a standardization effort proposed and run in-house, on our own initiative, inside a larger system build. Documenting the component's structure and usage laid groundwork that later screens and projects could pick up. The charting and visualization skills built here carried on into the next job, the oil refiner's web map service.

Highlights
A reusable chart component that separates data from display
Charts drawn the same way across many dashboard screens
Component structure and usage, proposed and documented on our own initiative
Insights
GA4 client_storage: 'none'은 정말 쿠키를 막을까?
두 달 전 이 블로그에 「GA4 쿠키 없이 쓰기」라는 글을 썼습니다. clientstorage: 'none' 으로 쿠키 저장을 끄고, 자체 분석이 쓰던 익명 ID 를 clientid 로 넘기면 쿠키 0개로 GA4 를 쓸 수 있다는 내…
GA4 Measurement Protocol: gtag.js 없이 서버에서 이벤트 보내기
랜딩 페이지의 전송량을 파일 단위로 쪼개 보다가, 가장 큰 파일이 우리 코드가 아니라는 것을 알았습니다. Google Analytics 의 gtag.js 였고, 방문 한 번에 176KB 를 받고 있었습니다. 페이지 전체가 1,094K…
중소 제조업 AI 도입 순서: DX를 먼저 끝내야 할까?
공장을 가진 중소·중견 제조기업 16만여 곳 가운데 스마트공장을 도입한 곳은 19.5%입니다. 회사가 작을수록 이 비율은 더 떨어집니다. 중소벤처기업부가 2025년 4월에 낸 제1차 스마트제조혁신 실태조사 결과입니다. 그림: 기업 규…
Next.js loading.tsx와 404: 버튼이 화면보다 먼저 살아나게 하기
관리 화면 왼쪽 위에 사이드바를 접고 펴는 ☰ 버튼이 있습니다. 폭 하나 바꾸는 버튼인데, 대시보드에서 누르면 2초 넘게 아무 반응이 없었습니다. 레이아웃만 바꾸는 일이 왜 이렇게 오래 걸리는지부터 들여다봤습니다. Next.js 16…