Charts for a promotion campaign
For a weight-management cereal brand's web promotion, we developed the screens that turn participants' entries into charts. The campaign offered interactive web content where consumers tracked and checked their own meals and weight changes. In a participation campaign the chart is where people check their own progress, so the focus was on making weight change, goals, and progress readable at a glance. The work was implementing chart screens that respond to the data.
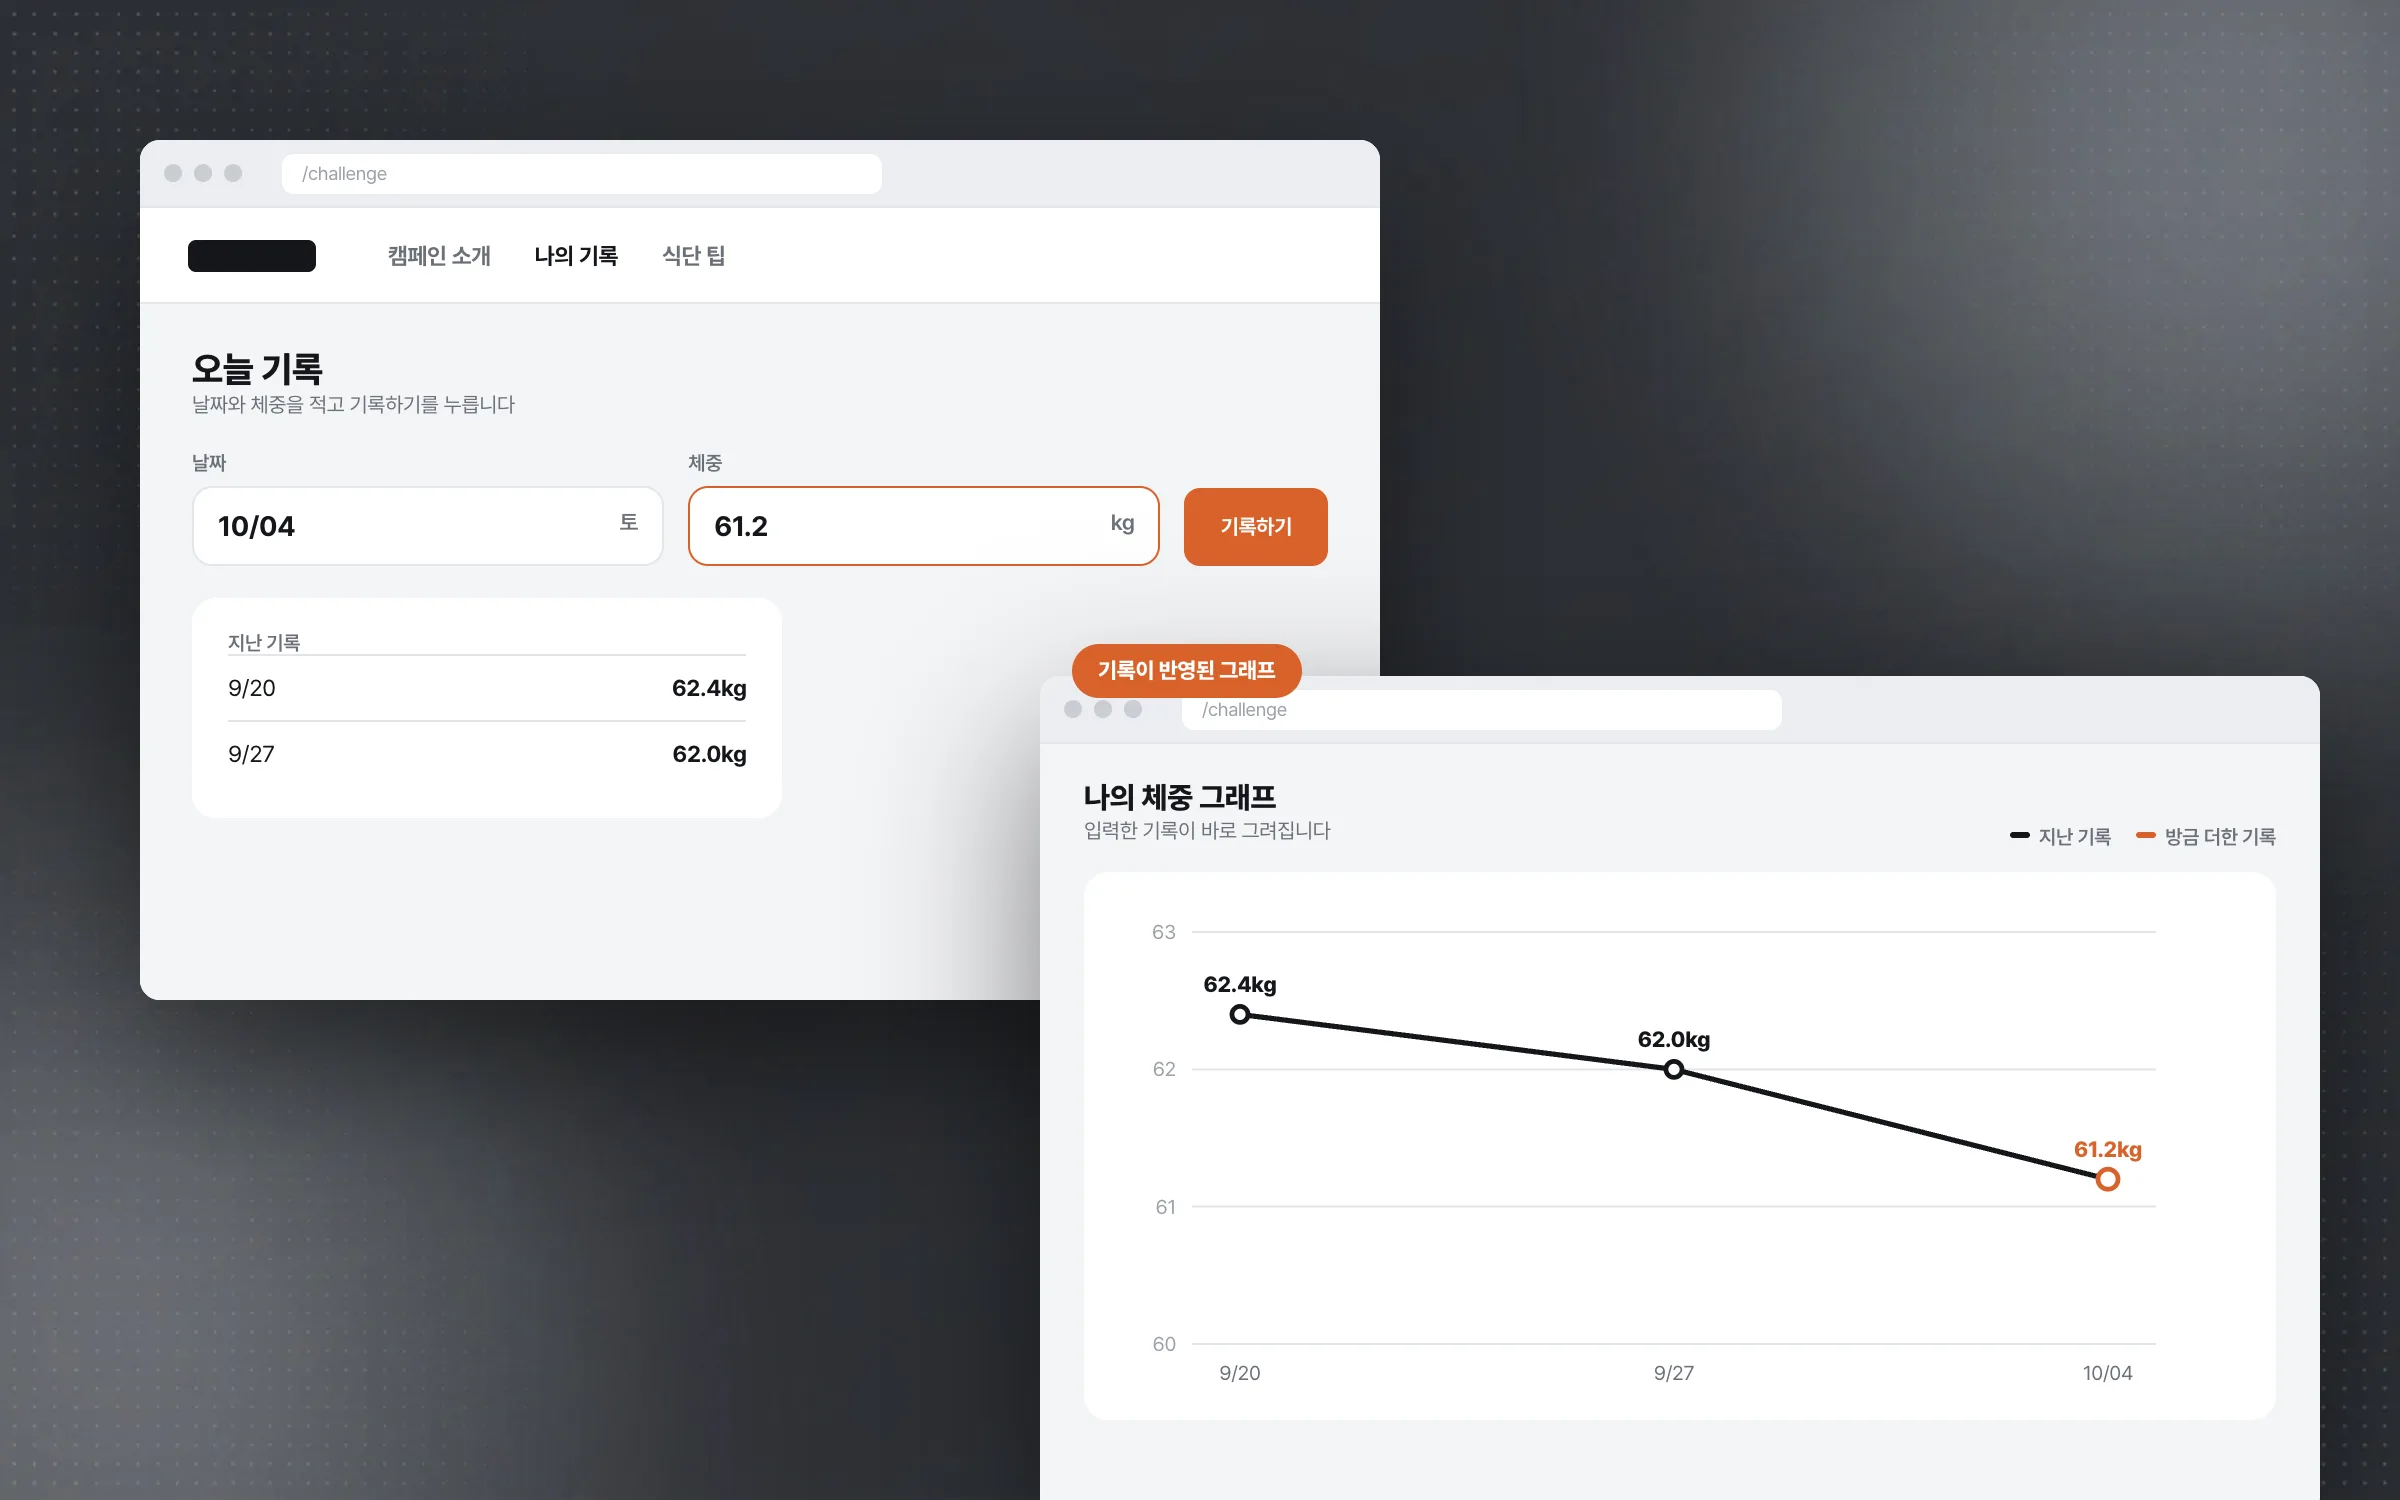
A personal record graph drawn straight from what participants enter
The weight-management campaign sites the same brand ran in several countries paired personal meal plans, shopping lists and exercise tips with a record screen where participants checked their own progress. On the weight-management campaign website, participants entered and checked their own meals and weight changes. We implemented the screens that show participants' entries and the campaign data as charts. Showing a graph instead of a list of numbers lets the build-up of records catch the eye first.

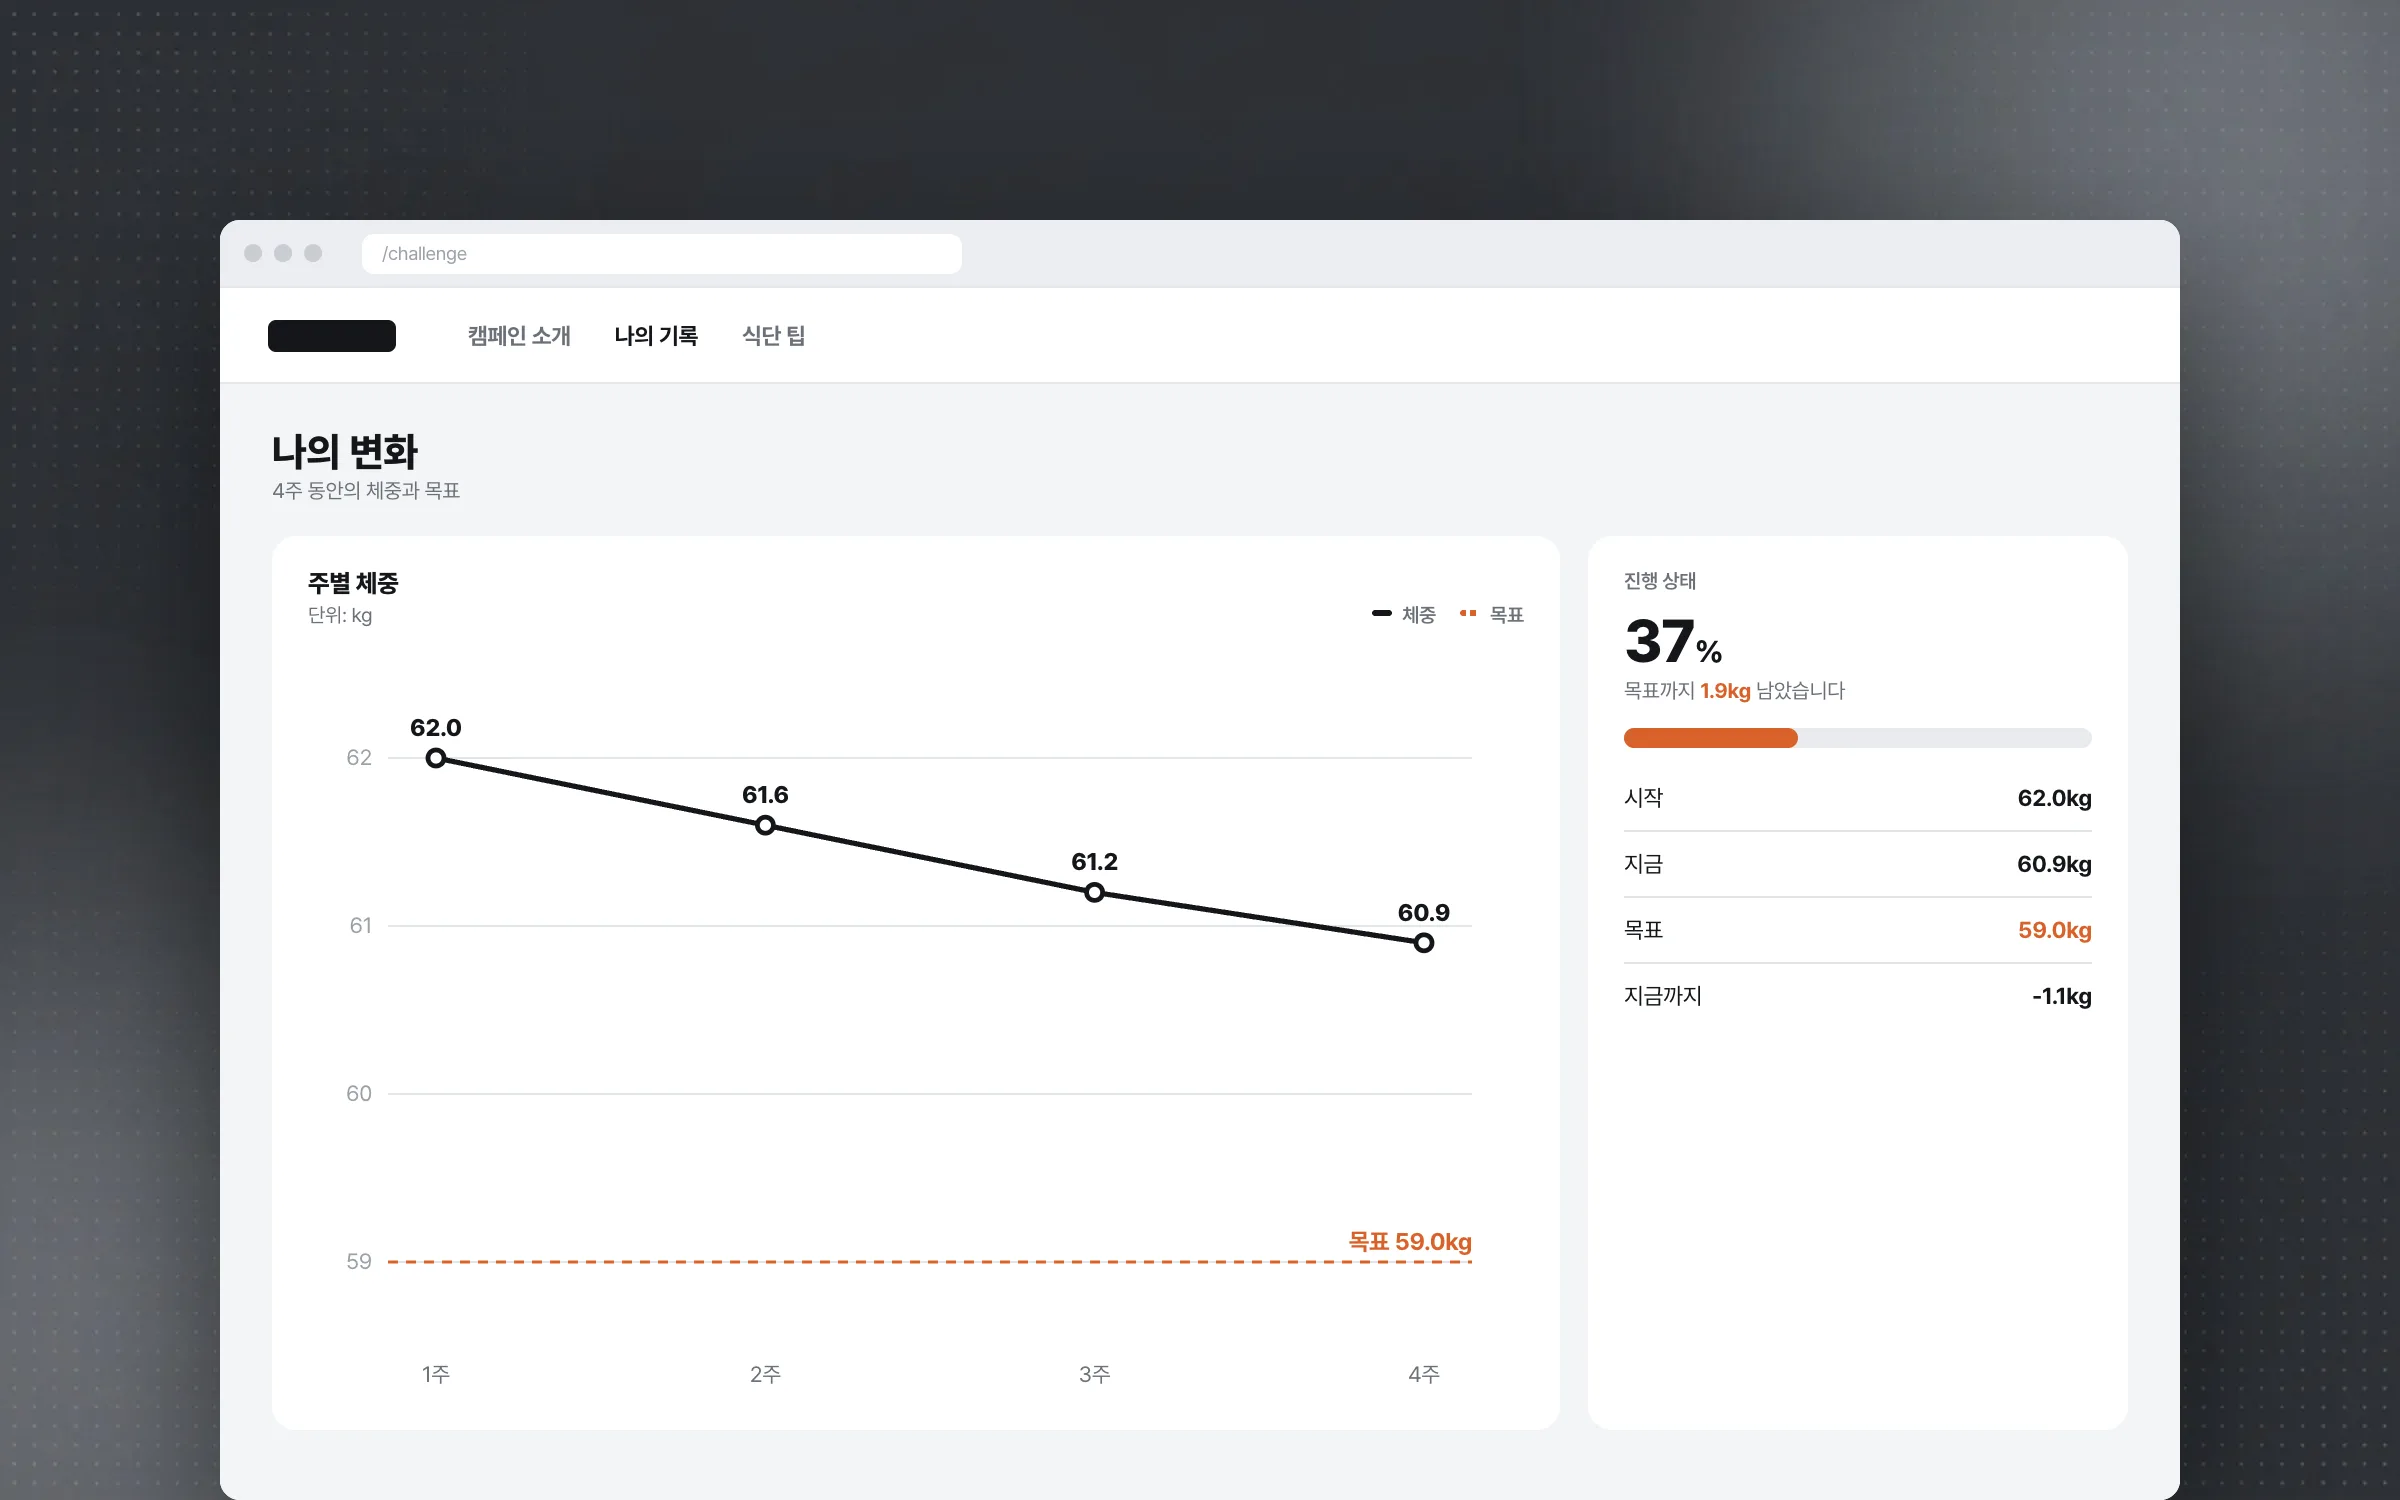
A layout that reads weight change, goal, and progress at once
The campaign chart screen shows three things together: weight change, the goal, and progress. Participants see on one screen how their weight has changed, where the goal is, and how far they have come. Because the campaign belonged to a brand that helps with weight management, the values in the chart were the participants' own weight and goals.

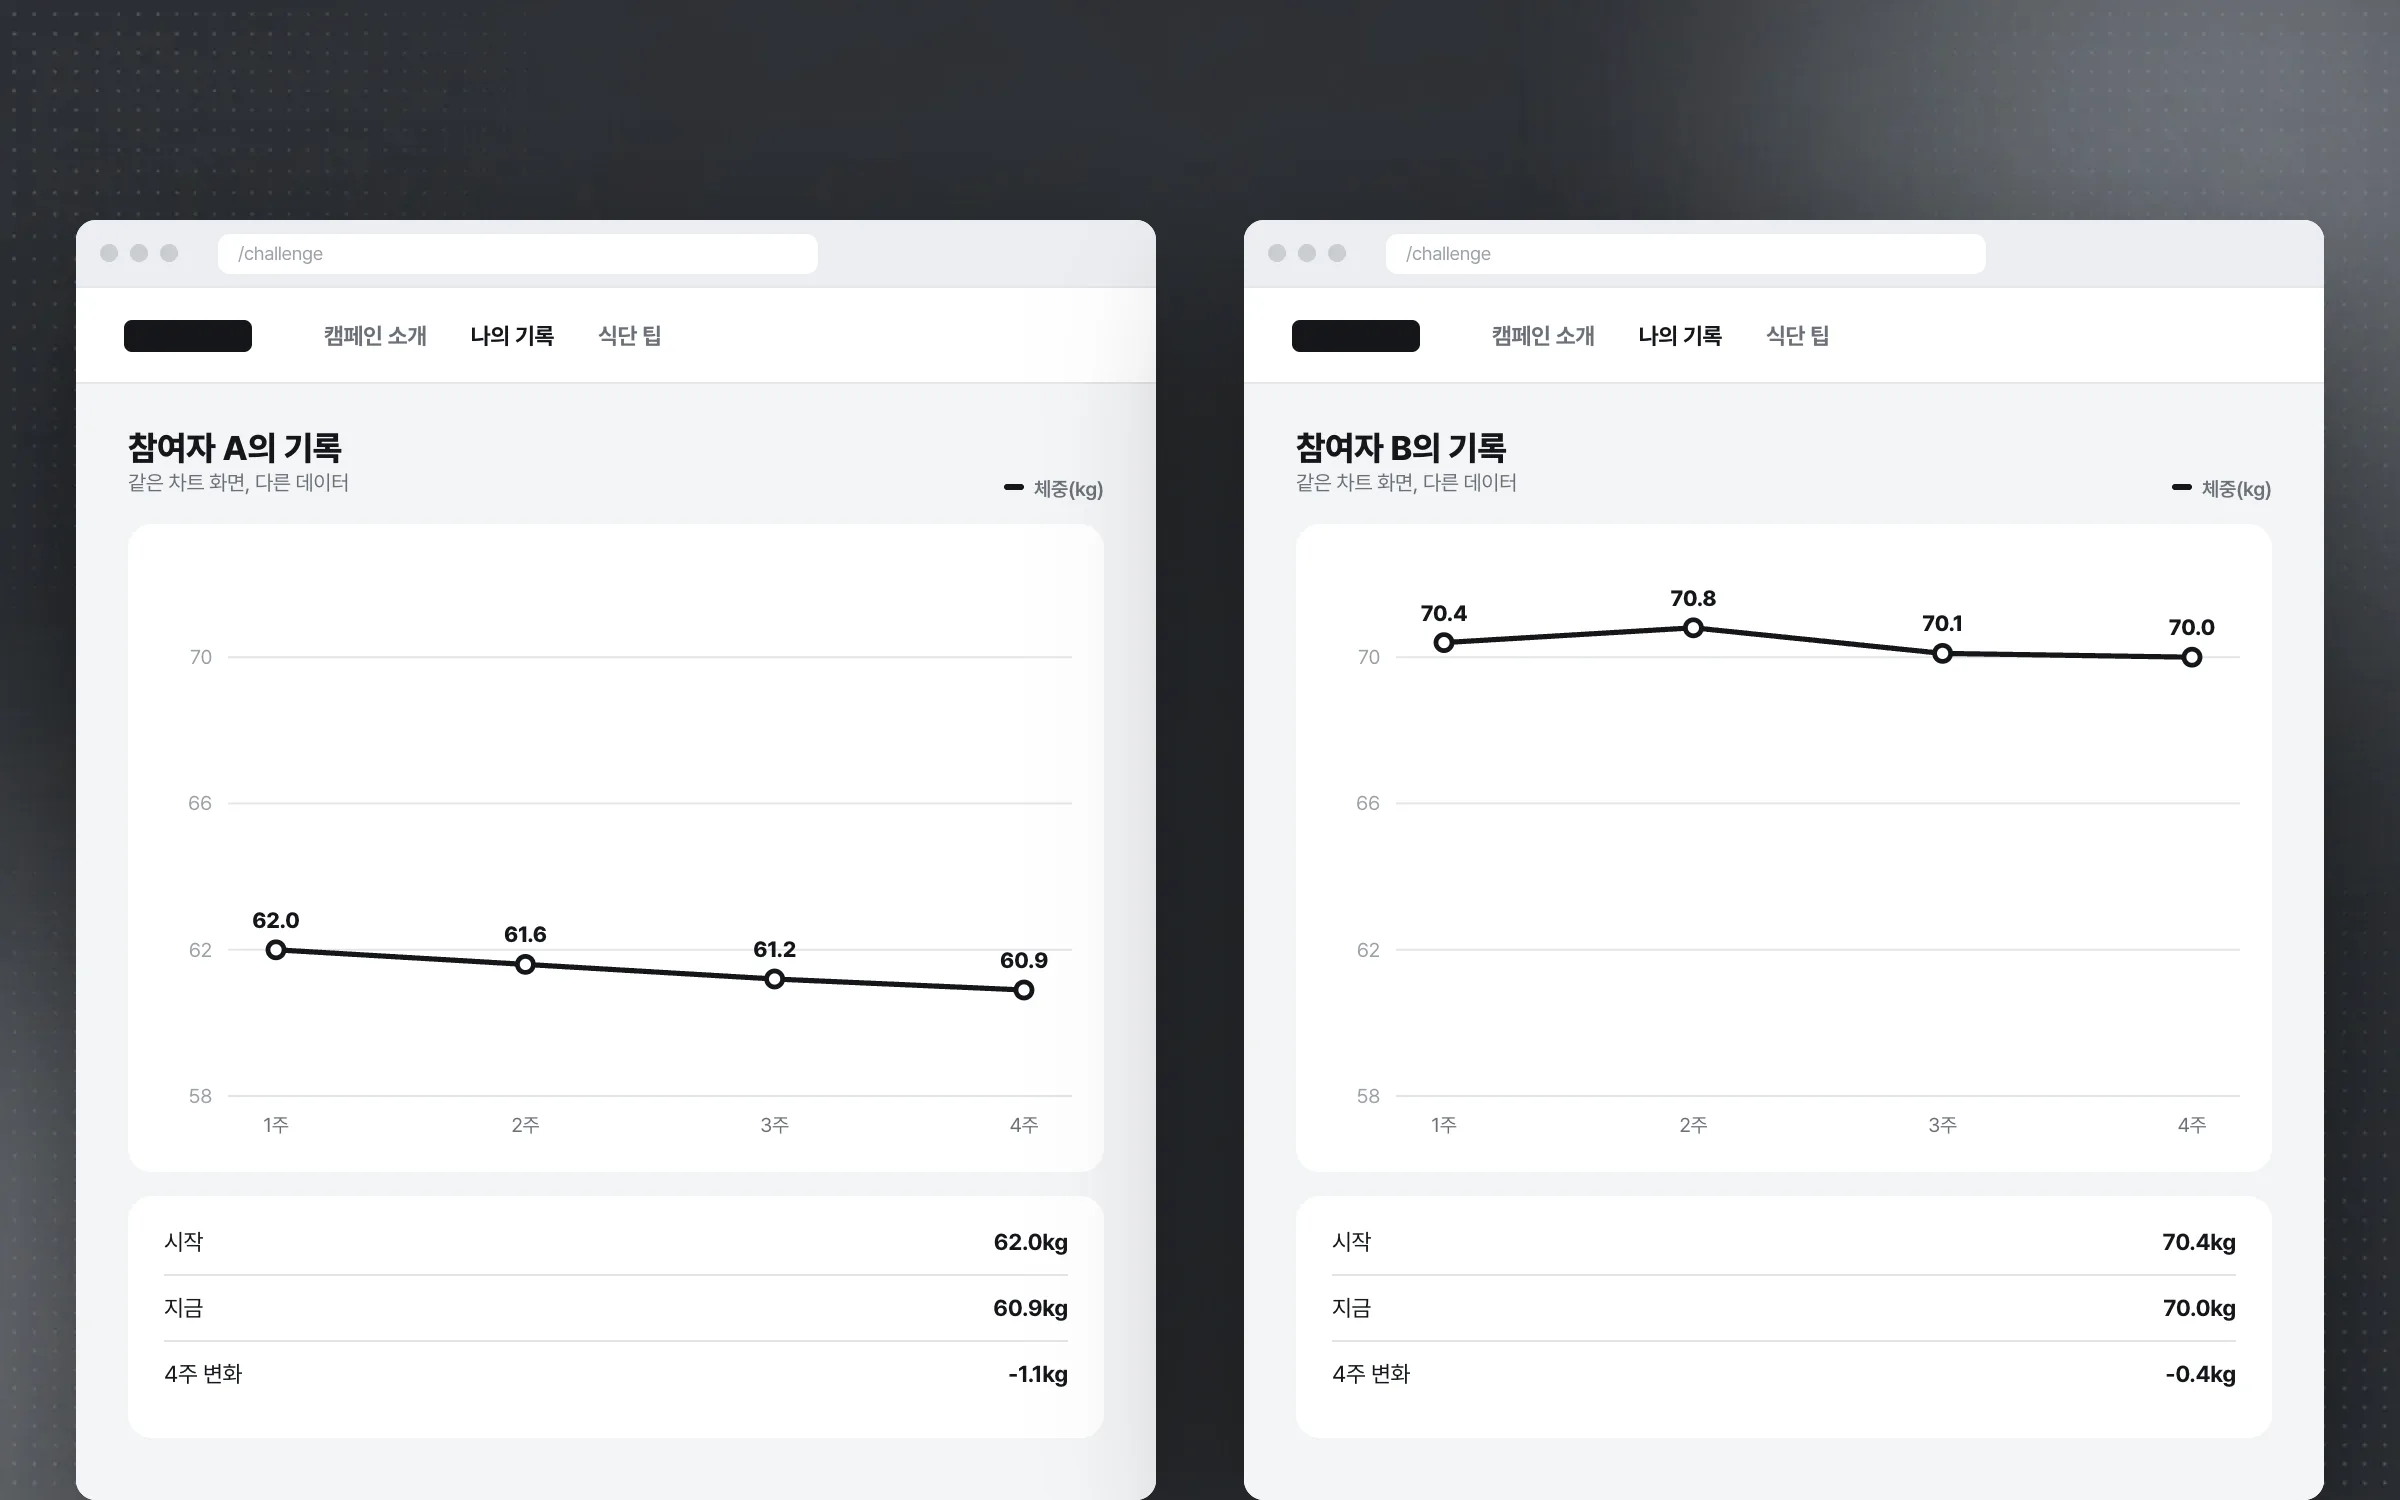
Charts that respond to data instead of fixed pictures
The campaign charts were built as interactive screens that respond to data, not as static images. When a participant's records change, the chart redraws to match on the same screen. A picture drawn in advance cannot show records that differ from one participant to the next.

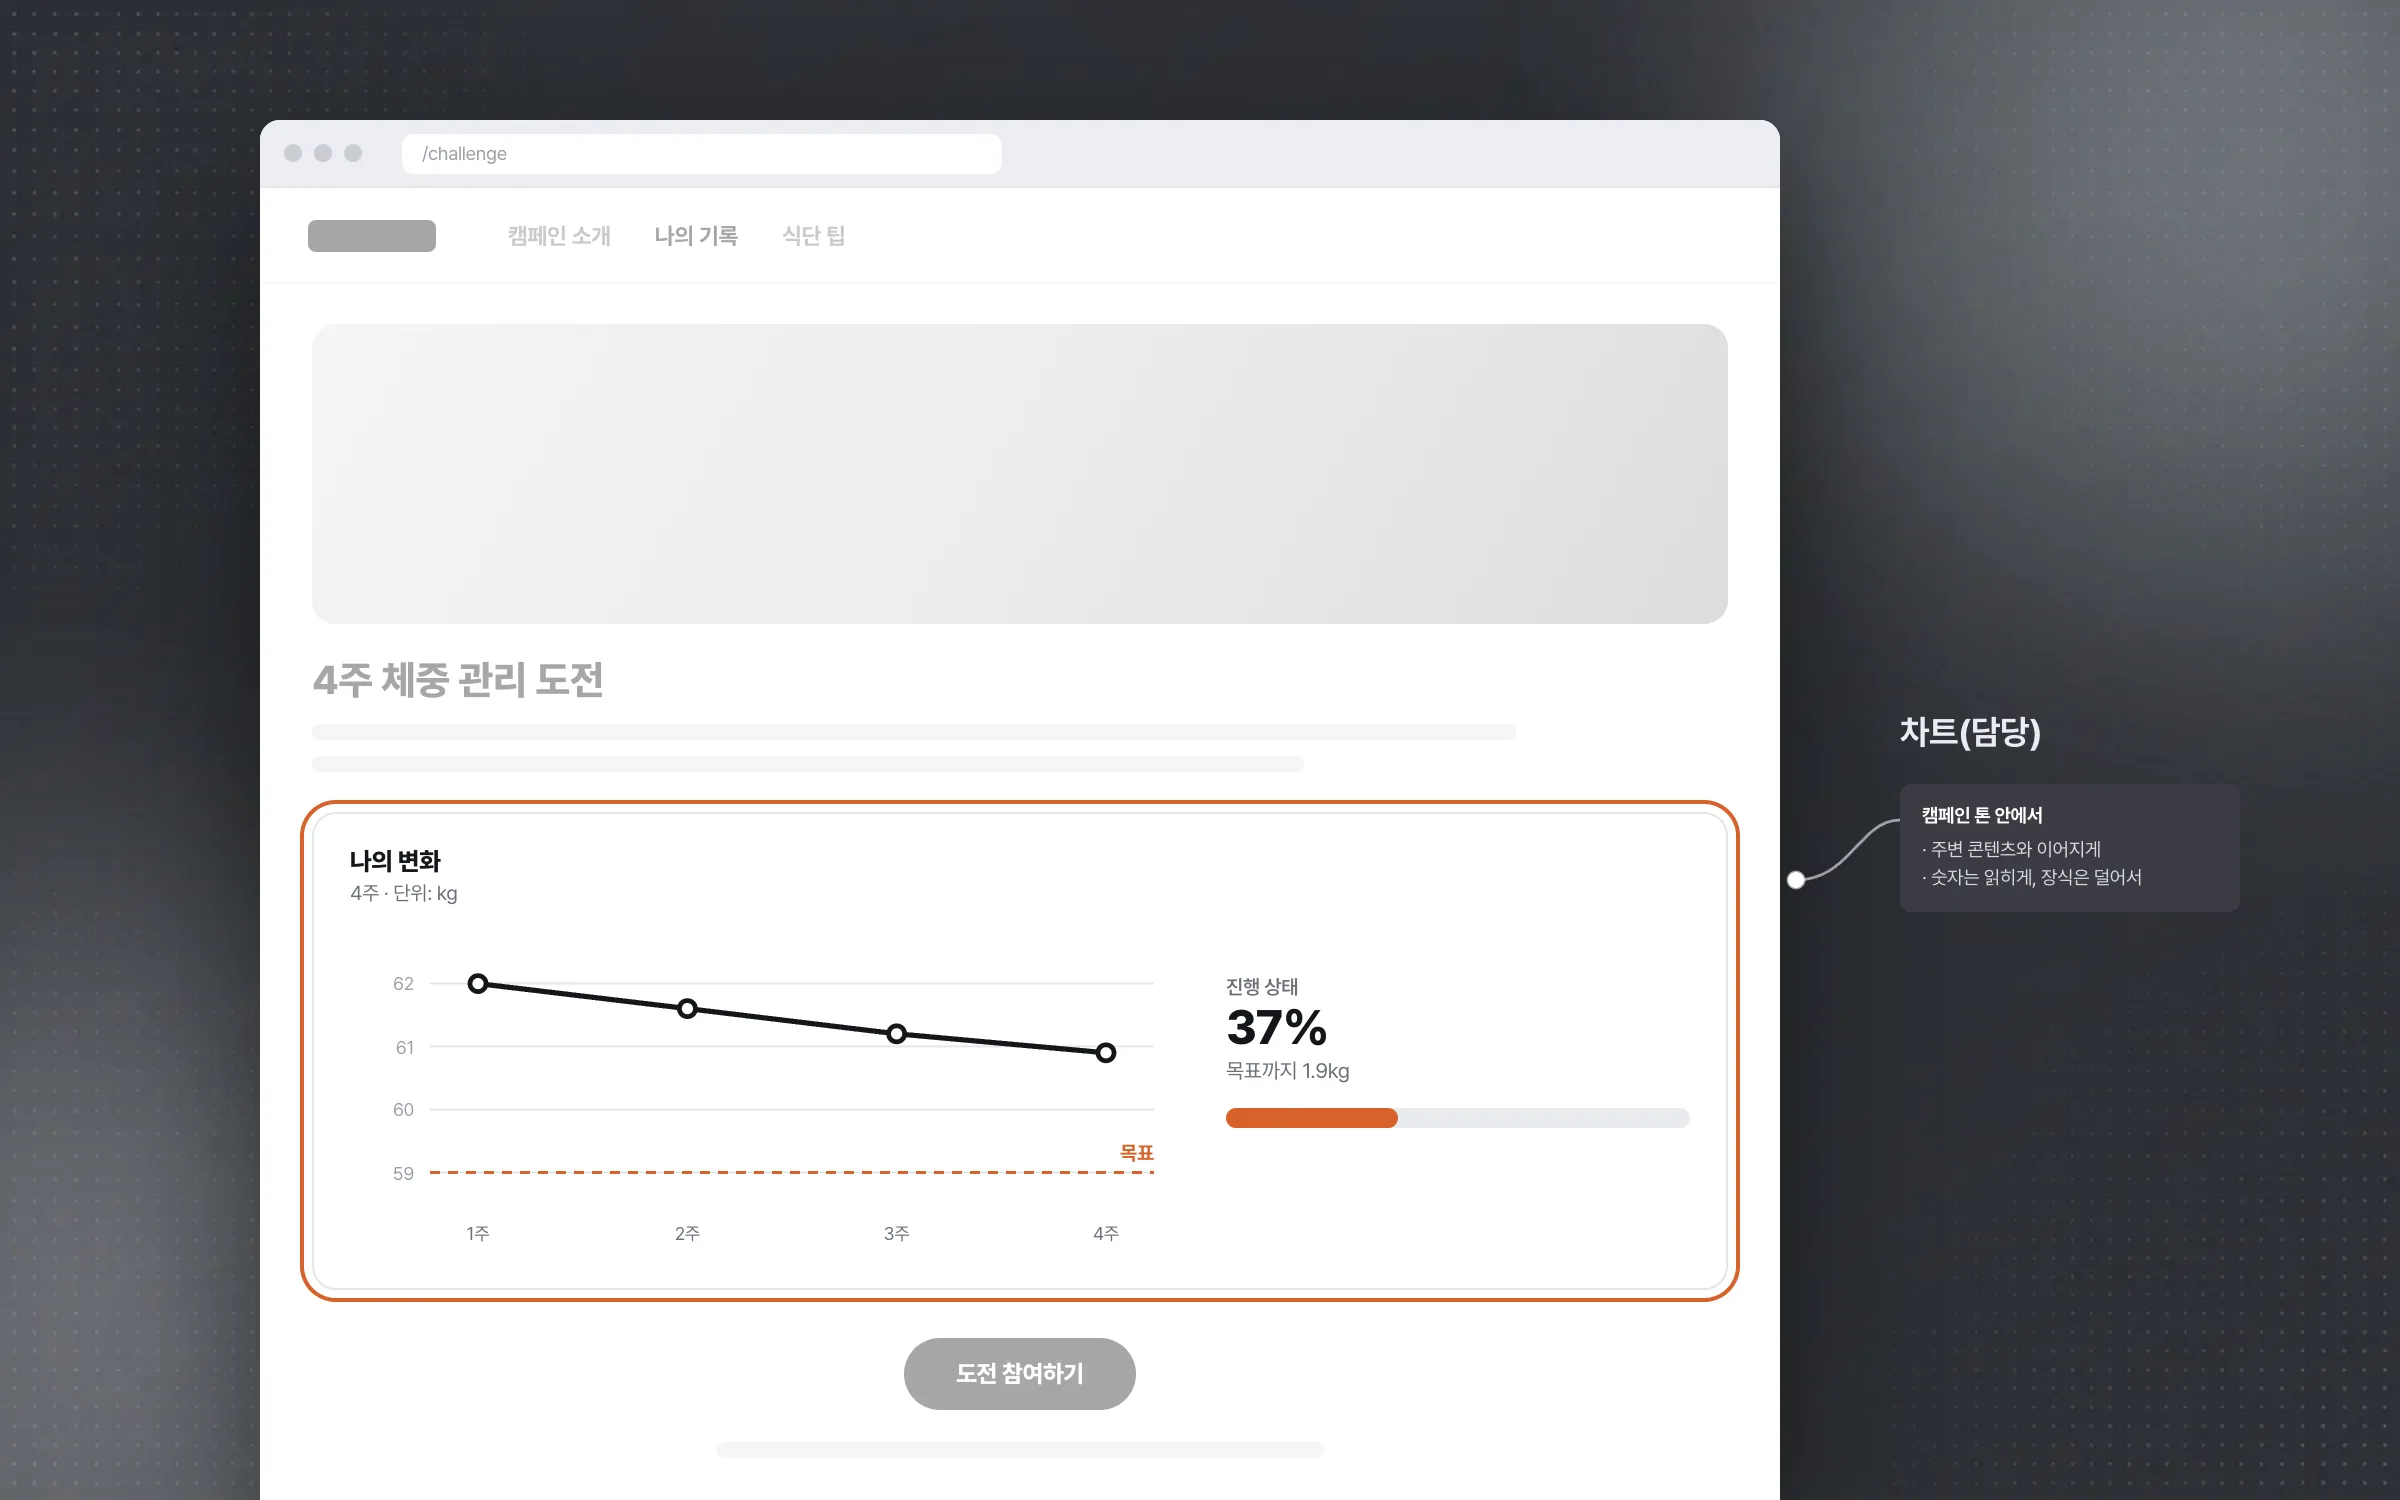
A balance that keeps the campaign's tone and keeps the numbers readable
The campaign chart sits inside marketing web content, so it had to follow the tone of the brand's campaign. We composed the screen so that the chart flows naturally into the surrounding content, balancing clear information against visual presentation. This work was part of a campaign run by a digital agency, and the chart experience built here led on to developing the same brand's mobile app.

Highlights
Web charts drawn from participants' own entries
Weight change, goal, and progress on one screen
Interactive screens that respond to data instead of fixed images
Insights
GA4 client_storage: 'none'은 정말 쿠키를 막을까?
두 달 전 이 블로그에 「GA4 쿠키 없이 쓰기」라는 글을 썼습니다. clientstorage: 'none' 으로 쿠키 저장을 끄고, 자체 분석이 쓰던 익명 ID 를 clientid 로 넘기면 쿠키 0개로 GA4 를 쓸 수 있다는 내…
GA4 Measurement Protocol: gtag.js 없이 서버에서 이벤트 보내기
랜딩 페이지의 전송량을 파일 단위로 쪼개 보다가, 가장 큰 파일이 우리 코드가 아니라는 것을 알았습니다. Google Analytics 의 gtag.js 였고, 방문 한 번에 176KB 를 받고 있었습니다. 페이지 전체가 1,094K…
중소 제조업 AI 도입 순서: DX를 먼저 끝내야 할까?
공장을 가진 중소·중견 제조기업 16만여 곳 가운데 스마트공장을 도입한 곳은 19.5%입니다. 회사가 작을수록 이 비율은 더 떨어집니다. 중소벤처기업부가 2025년 4월에 낸 제1차 스마트제조혁신 실태조사 결과입니다. 그림: 기업 규…
Next.js loading.tsx와 404: 버튼이 화면보다 먼저 살아나게 하기
관리 화면 왼쪽 위에 사이드바를 접고 펴는 ☰ 버튼이 있습니다. 폭 하나 바꾸는 버튼인데, 대시보드에서 누르면 2초 넘게 아무 반응이 없었습니다. 레이아웃만 바꾸는 일이 왜 이렇게 오래 걸리는지부터 들여다봤습니다. Next.js 16…